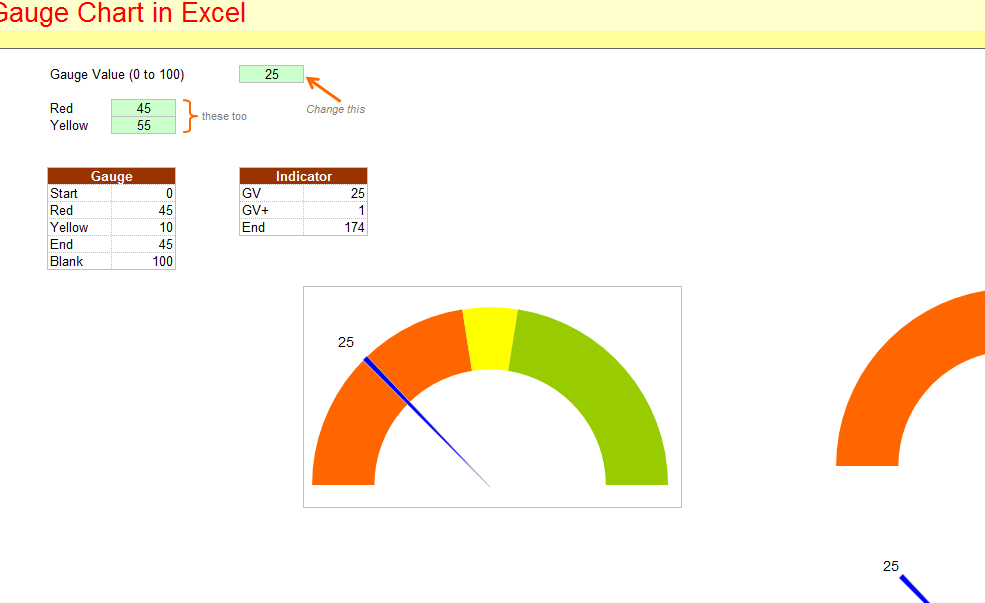
Have you ever wanted to track the progress of something in a way that’s simple and easy to read? The Gauge Chart feature in Excel is the best way to accomplish this feat. You can use this feature to create a gauge or speedometer chart that continually progresses a dial as you make your way to achieving your goal. This visual representation of your data can be used to show coworkers or employees your expectations and give you an easy way to track the progress of any project. Whether you’re trying to reach a sales goal or want to keep track of an individual employee and their performance, the Gauge Chart is a great method to organize all this information in a neat and tidy way.
How to Use the Gauge Chart Feature in Excel: Steps
Start by downloading the free template at the bottom of this screen to follow along with the tutorial and practice first. You can also use your personal spreadsheet if you just want to get down to business.
In order to create a Gauge Chart, you’ll have to enter your data points and select a range. In the included example, the data from the Gauge Chart is constructed from cells B11:C16. Note that the example has a few extra features, simply ignore these for now.
Enter your data where you want this information to go and highlight your range. Next, you will need to click the “Insert” tab at the top of your screen.
In the Insert menu, select the “Other Charts” button and press the “Doughnut Chart” option.
Remember to change your fills in the chart to either a Solid Fill or No Fill. This can be done in the “Format Selection” table at the top.
It’s best to choose your Doughnut series first, and then click the “Format Selection” button to change your angles to 270 degrees.
Finally, select your chart and right-click on it. All that’s left to do is choose the “Format Chart Area” to change to No Fill and No Line. Keeping the original legend is completely optional, but you don’t really need it at this point.
Download: Using a Gauge Chart in Excel
Related Templates:
- How to Format Data with Excel
- How to Create Charts in Excel
- How to Modify Cell Movement
- Highlight Rows in Excel
- Inserting Rows and Columns in Excel
View this offer while you wait!
