
Now regarded as a common charting technique, Gantt charts were considered revolutionary when they were first introduced by Henry Gantt. The basis of a Gantt chart is to illustrate a project schedule using bar graphs that cover the entire time period of a project. Gantt charts illustrate start and finish dates of the terminal elements and summary elements of a project. Many professionals use Gantt in Excel in their business operations. You can use Gantt in Excel to manage project timelines with this free Gantt chart Excel template. Download this Gantt chart Excel template right here for free.
Using the Gantt Chart Excel Template
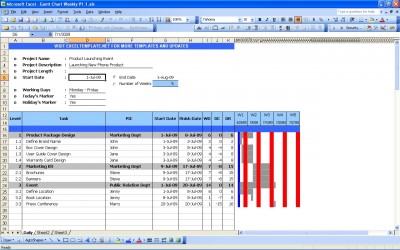
This example Gantt chart lets you prioritize your tasks, delegate tasks to different workers, assign start and finish dates, and track their progress over a weekly periods. This Gantt in Excel was designed to be easy and simple to use. You can use this Gantt chart template to manage a project schedule with five, six or seven working days and present day and holiday color choices as markers inside the Gantt chart bar table.
This Gantt chart is free to download. Be sure to browse our library of free Excel templates for more Gantt charts and other useful business Excel templates. See the related templates below for other Excel Gantt charts and a Gantt chart worksheet.
Related Templates:
- Excel Gantt Chart
- Team Project GANTT Chart
- Project Management Gantt Workbook
- Advanced SEO with GANTT Chart Planner
- Gantt Chart Worksheet
View this offer while you wait!
very good