
Keeping a log of your financials can be helpful for staying in control of a budget and analyze how money is spent, and saved. Most people use a regular spreadsheet program to keep up with their money goals, and to have an idea of how to keep on top of it. This works well for some, but for others nothing is more clear than the impact a visual representation of their financials can give them – then a modern day three-dimensional Excel pie chart.
With text fields that are ready to input information, the Excel pie chart template is easy-to-use and customize with any financial information you want to see in full color. With the pie chart anyone can clearly understand the numbers of their finances more so then just written down on a line. The template can be downloaded from this page for free. It is compatible with Microsoft Excel 2007 or later.
How to Use the Excel Pie Chart Template
- Download the free Excel pie chart template to your computer and save to any folder or to the desktop for quicker access to the file.
- Once you have downloaded the file – find it and open it to start editing the template with your information.
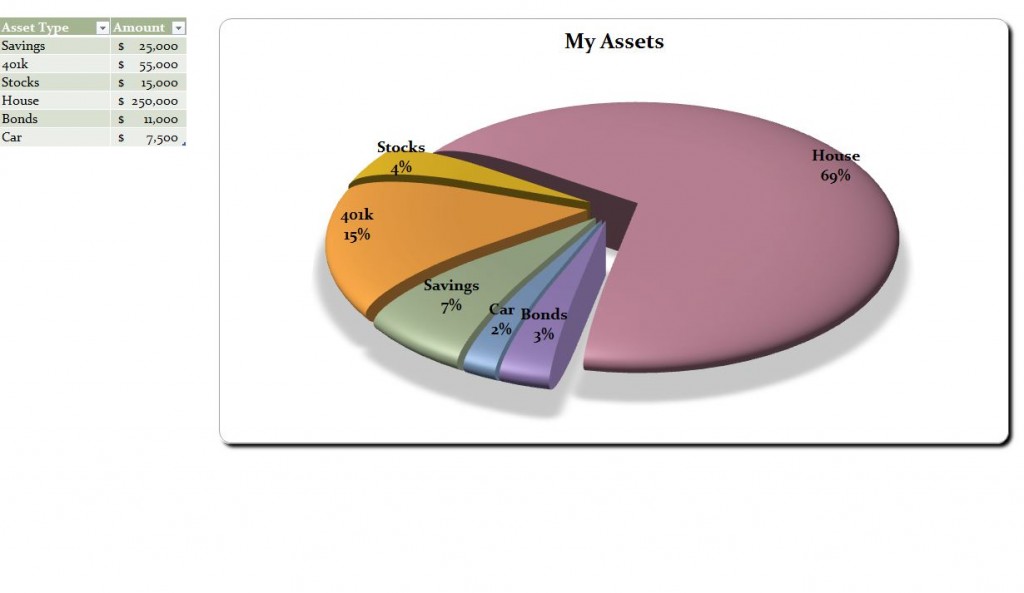
- On the left side of the sheet you will see the asset types and money amounts set as examples. You can edit any of these fields with your own financial details. You can also add other assets or delete the ones you do not need on the pie chart.
- As you enter the money amounts for each one, you will see the Excel pie chart change according to what was entered. Once done you can see the visual details of your finances as a three-dimensional image.
Tips for Using the Excel Pie Chart Template
- This Excel pie chart can be used on other financial matters you want to track. If you have separate bank accounts for business, and for personal situations, you can create a pie chart for each account.
- Adding information is easy and as it is entered for dollar amounts, the pie chart will show it in colorful and precise detail. Giving you the options to add to or deduct from.
Using the Excel pie chart is a productive way to get a visual idea of how your finances are going according to your goals, and plans. With this information anyone can adjust their spending and savings to suit their needs for current or future planning.
Download: Excel Pie Chart
Related Templates:
- Manufacturing Output Chart
- Cash Flow Chart
- Pie Chart Generator
- Free Check Register Template
- Financial Account Register
View this offer while you wait!