
The Variance Report Template allows accounting professionals to analyze critical line items on an income statement. The report also allows professionals to analyze a company’s financial standing based on an organization’s overall financial strategy. Business executives can examine the state-of the business, once the Variance Report Template is prepared.
Companies are able to determine and evaluate the economic risk of certain business strategies based on economic trends. Variance reports also allow organizations to target the reason behind discrepancies identified in the report. Correctly analyzing the report will allow companies to create new objectives and financial strategies. The template is easy to use and available on this page as a free download. The template can also be easily modified to meet the needs of your organization.
How to Use the Variance Report Template
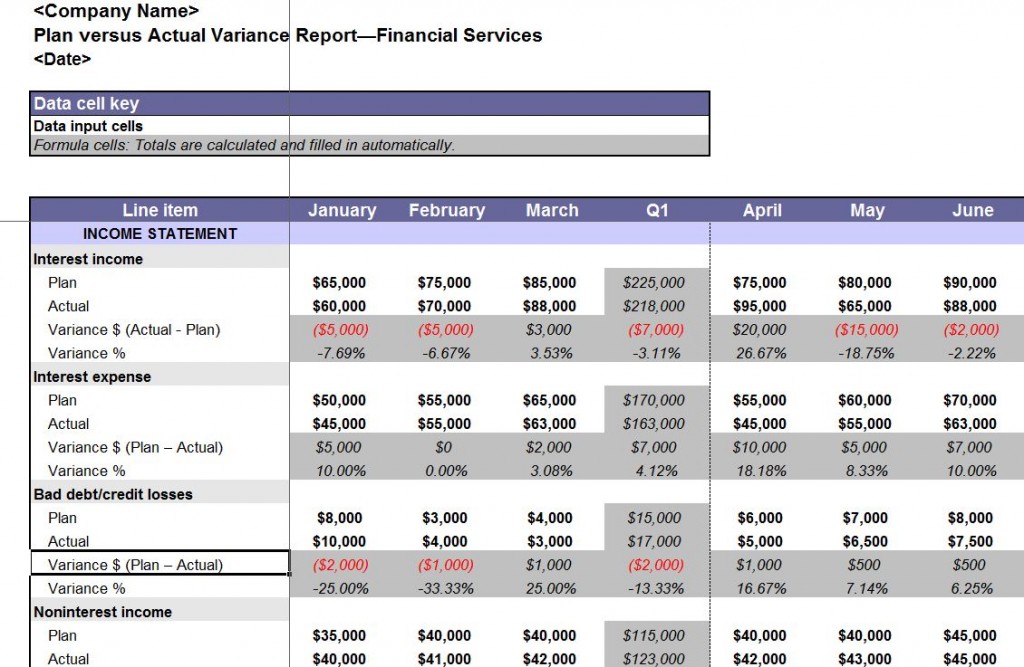
The first step is to simply input planned and real data into the worksheet. The template will automatically calculate the variances for the line items based on the threshold for the organization. The template also allow users to add notes to the worksheet.
Financial analysts will be able to identify if a company is within, over or under their predetermined financial goals. In tough economic times, it’s vital for a businesses to thoroughly monitor underspending and overspending. If the figures are not in line with the goals set forth by the company the whole budget might have to be reexamined.
The Variance Report Template can also be used as a chart of the analysis. The two main areas to target is overspending and underspending. Overspending is an indicator that a project is in jeopardy and that adjustments must be made immediately to meet the projected goals of a business. Even though some may view underspending as a positive, this is not always the case. If the projections are correct, production may not be allocating the right amount of resources to produce the product. Under spending may also signal a difficulty in quality control.
Further Analysis with Variance Graphs and Tables
The Variance Report Template reveal variances by budget period, item and jobs. The standard variance is 5%. Graphs provide another method to recognize trends. The variance report can also provide both table and graphs to provide a complete assessment of the report.
Are the Results Favorable or Unfavorable?
A Favorable/Unfavorable report also takes into consideration how a favorable or unfavorable line item affects a business. The variance is shown as positive, if earnings are above the established budget. If the expenses are over budget, the variance will reflect an unfavorable indicator.
Download: Variance Report Template
Related Templates:
- Plan vs Actual Variance Report
- Quarterly Budget Analysis Template
- Home Budget
- Pro Forma Business Template
- Annual Financial Report
View this offer while you wait!