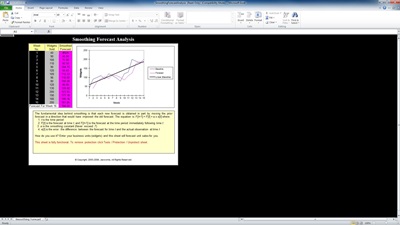
Smoothing forecast analysis is a set of processes that can be applied to time series of data, to produce data for presentation or to make a forecast. The time series of data is a product of observations. It is randomly bit ordered process. Smoothing forecast is mainly for economic and financial data, but it can also be used for repeating measurements. The raw data sequence is often represented by {xt}; the output of smoothing algorithm is represented by {st}.
These are estimations to find the best value of “x”. The essential idea behind the smoothing forecast analysis in an Excel sheet is to see the old forecast’s impact on the new forecast in a direction that would have improved the old forecast.
Related Templates:
- 12 Month Sales Forecast
- Financial Forecast Report
- Rolling Business and Budget Forecast
- Sales Forecast
- Detailed Sales Pipeline Funnel Management Template
X
Your free template will download in 5 seconds.
View this offer while you wait!
View this offer while you wait!
