
If you’ve ever dreamed of owning a financially smooth business, then you know the struggles of trying to keep costs and expenses organized. The free Cost Analysis with Pareto Chart is the ultimate way to organize the expenses of your business so you can later analyze the data you see. The only thing you need to worry about is entering your business costs as they come so you can receive accurate data in return. To download this free template and learn how to use it, just follow the guide we have provided for you below.
Using the Cost Analysis with Pareto Chart
To download, follow the link at the bottom of this page.
The next step will simply be to enter your expenses as they come. Start by listing the most important and recurring costs of your business in the table at the bottom of this template page.
You will see a list of examples so you know exactly what to enter. However, if you need to change anything on the template, click the cell and write something else instead.
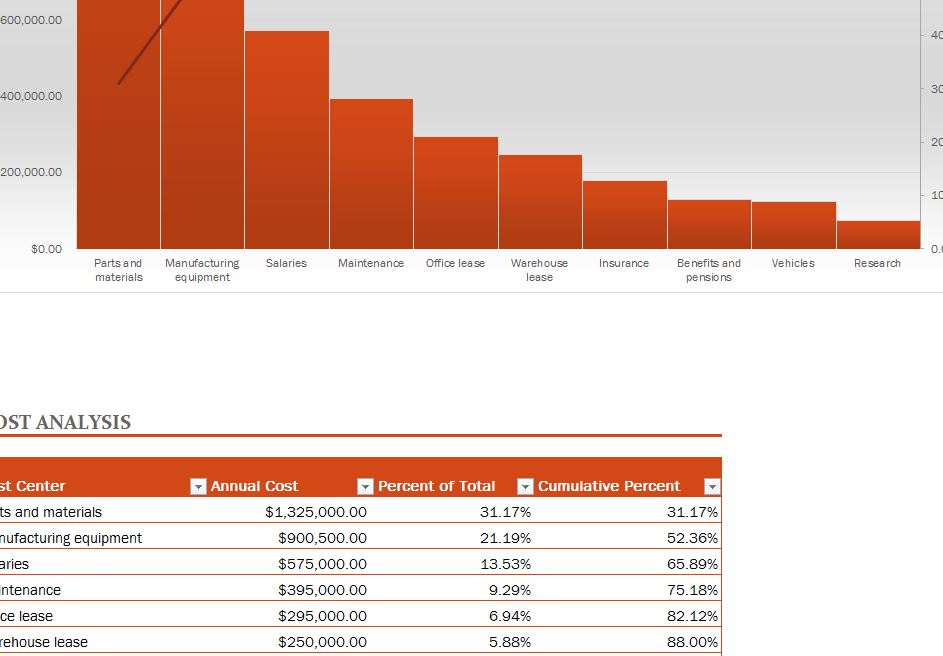
Now, after you have entered the name of the item, enter its annual costs. The template will then take your annual costs and give you totals for both the item and the cumulative percentage of all your other costs when you have completed this table.
Scroll to the top of the page to receive a complete overview of this information in the bar graph overhead.
The graph displays costs against your expenses so you can clearly see what’s costing you the most money over time.
The graph will also display a red line that illustrates when you have gone over budget on your expenses as well.
Using this template, you will be able to analyze your business costs and see where you need to make change to ensure the success of your business overall.
Download: Cost Analysis with Pareto Chart
Related Templates:
- Pareto Analysis Chart Excel Template
- Customer Profitability Analysis
- SWOT Analysis Sheet
- Total Cost of Ownership Calculator
- Cost Tracker Template
View this offer while you wait!