
If you’re someone that owns a small business and you find it impossible to discern your sales figures from last year with projections of sales in the future, the Trendline features in Excel can help you. Sometimes sales trends are hard to read. You might have outliers that make your sales trends look positive for one product when in reality they were not as great as you initially thought. The Trendline feature will calculate the overall trend within your data and give you a clear inclining or declining line in which you can use to make informed decisions about your business. One of the most common Trendline options used in Excel is the “Moving Average” Trendline. This type of line is a linear Trendline that creates a line to perfectly fit all the data points from your most recent entries.
Steps to Create a Trendline in Excel
At the bottom of this page, there is a sample spreadsheet you can download for free to practice the tutorial with. You can also use your own spreadsheet to start utilizing a Trendline right away.
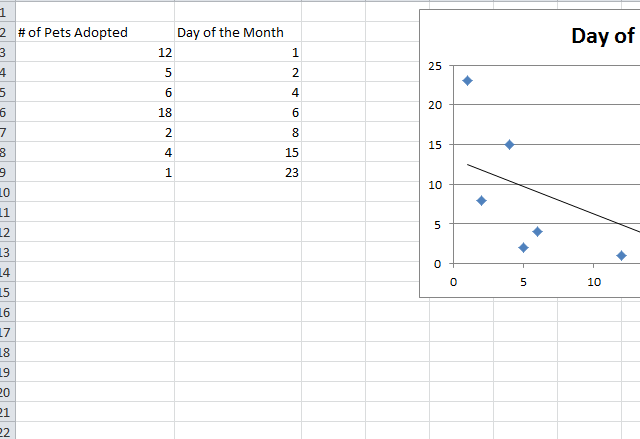
The first thing you’ll need to do is create a set of data like the one displayed in the sample document. This usually consists of two columns for your X and Y data to be displayed on a chart or graph. Next, you will highlight your data and click the “Layout” tab in the “Chart Tools” ribbon at the top of your page.
The “Trendline” button will be displayed in the menu below. This will bring up a drop-down menu for you to select a specific Trendline from the list provided.
In the list of options of the Trendline menu, you will click on the “Moving Average” option.
Repeat the process of highlighting your data and selecting the same Trendline options as you did above to ensure that the data is correct. Remember, you need to make sure that for this particular data set, the “Moving Average” option is highlighted.
In the “Moving Average” selection menu, there is a space marked “Period.” Enter the amount of periods you want to be used within your average calculation of the Trendline. This is useful for removing data that may skew your results.
Simply select the number of data points you want your trends to use for the projection.
Now you have an exciting new to maximize profits in your sales by predicting reliable models based off your past successes.
Download: Using Trendlines in Excel
Related Templates:
- How to Make a Gauge Chart in Excel
- Using the AUTOFILTER Function in Excel
- How to Use the Goal Seek Function
- How to Create Charts in Excel
- Inserting Rows and Columns in Excel
View this offer while you wait!