
The U.S. Oil & Natural Gas Reserves 1964-2014 template is a simple Excel sheet that explains the rapid declines and upward trajectory of the United States’ natural gas reserves from the period of 1964 to 2014. This data can help you with a variety of reports and documentation. All the information that has been provided on this template is accurate, concise, and comes from the U.S. Energy Information Administration. You can start using this free template by following the guide below.
Downloading and Using the U.S. Oil & Natural Gas Reserves 1964-2014 Sheet
You can download this free template by scrolling to the bottom of this page and clicking the link below.
The next step is to take a look at the information provided on this document. You will receive a detailed list of the following items.
- lease condensate & combined data displayed in million barrels (MMBbl).
- Gas reserves showed in Bcf (Billion Cubic Ft).
- Data displayed in a tabular and chart formats.
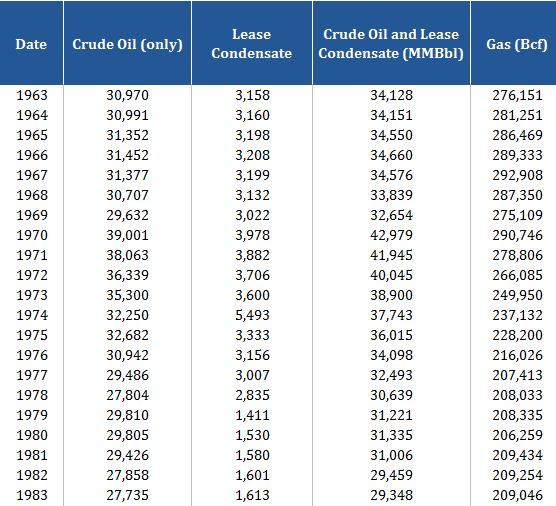
When you take a look at the template, the first thing you’ll see are graphs that illustrate the crude oil and lease condensate proved reserves by billions of barrels. The graph to the right shows the United States’ natural gas proved reserves.
These graphs serve as a quick reference guide to the information below. This table shows you everything. You can see the crude oil, lease condensate, gas, and much more in this small table. The information goes from 1963 to 2014.
This template is the ultimate guide to U.S. Oil & Natural Gas Reserves and gives you valuable data in case you plan on making investments or need the data for business purposes.
Get started today by clicking the link at the below.
Download: U.S. Oil & Natural Gas Reserves 1964-2014
Related Templates:
- Coalbed Methane Proved Reserves
- Henry Hub Gulf Coast Natural Gas
- Valuing Natural Resource Template
- Lease Payment Calculator
- Operating Lease Converter
View this offer while you wait!